武汉

400-999-9090
全国咨询热线服务
欢迎来到环球教育官方网站,来环球,去全球,名师高徒,高分留学!

来源:环球教育整理
小编:环球教育 314下面小编为大家整理了雅思小作文曲线图攻略及范文,供考生们参考,以下是详细内容。
曲线图 范文 1(引题段):
【第一句】The curve illustrates the number of cases of A-type crimes committed in the UK between the years 1990 and 2004.【第二句】It can be seen that A-type crimes decreased dramatically to 200 cases around the middle of the 1990s and then increased to 2000 before the year 2000.
范文 2:(全文)
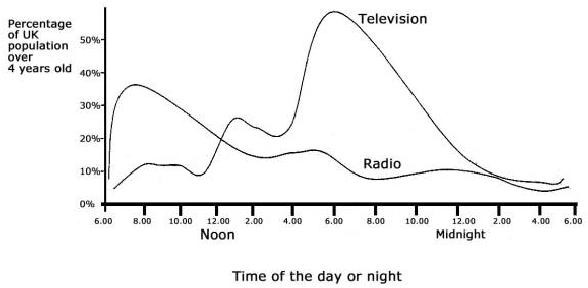
From the graph, we can see clearly that in the early morning, at 6 a.m., few people watch TV. However, from this time onwards, the number of TV audience is on the rise. At noon, the people watching TV account for about 8% of the total population. In the period between 12:00 and 2:00 p.m., the TV audience experiences a sharp increase from 8% to approximately 18%.
From 2:00 p.m. to 4:00 p.m., the figure remains constant at about 18%, then balloons to the peak of the day, reaching approximately 50%. The number of TV audiences drops dramatically from 10 p.m. till it reaches its bottom at 3 p.m.
On the other hand, there is a sharp increase in radio audience from 6.a.m to 9 a.m., peaking at about 28% at 8:30 a.m. However, from this point onwards, it declines gradually for the rest of the day, bottoming out at 4:00 a.m. the next day.
In brief, the number of TV and radio audiences varies according to different phases of time probably due to the different features of these two media.
以上就是小编为大家整理的雅思小作文曲线图攻略及范文,非常实用。最后预祝大家在雅思考试中取得好成绩!